An RNA therapeutic: Antisense oligonucleotide (ASO) therapy.
Since the advent of the human genome project, scientists have rapidly advanced our understanding of DNA and RNA sequencing. One big advantage of this is that we have been able to identify the genetic roots of several diseases such as cancer, Parkinson’s, rheumatoid arthritis, and Alzheimer’s. This knowledge has been thoroughly applied to diagnostic use; however, its full potential for treating these diseases has not been realised.
How wonderful would it be to target specific disease-causing genes or modulate genetic defects with antisense oligonucleotides (ASOs)?
Recently, RNA- and DNA-based drugs have shown great promise in treating diseases at the transcriptional and genetic levels.
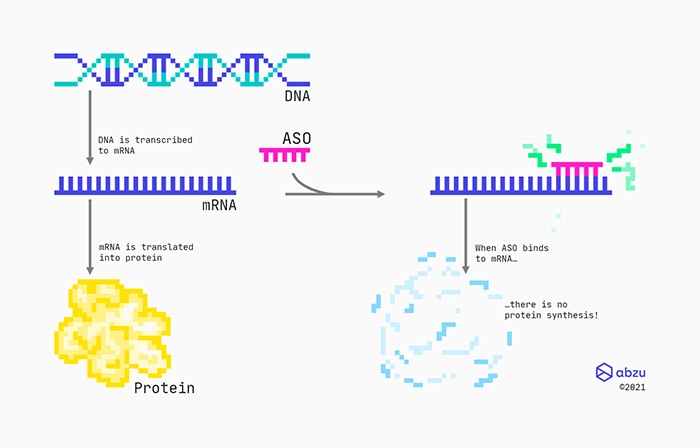
Mechanism of action for RNase H recruiting ASOs targeting protein-coding RNAs.
One specific type of drug is made from chemically modified engineered oligonucleotides that are complementary to a specific messenger RNA (mRNA). Designed as RNase H recruiting ASOs with a middle part consisting of DNAs, they bind to the mRNA through standard base-pairing. These types of ASOs will have flanks consisting of modified nucleotides, which not only will protect them from enzymes, but also help them bind to the targeted RNA. Between the flanks, there is a stretch of DNA nucleotides, also called the gap. Therefore, these types of ASOs are also often referred to as gapmers. The RNA:DNA hybrid formed between the RNA target and the gapmer is recognised by the ribonuclease RNase H enzyme, which cleaves the RNA. Finally, the cleaved RNA rapidly degrades because its ends are left unprotected.
The ASOs we will discuss in this blog post are LNA gapmer, i.e. the modified sugars in the flanks are LNAs. Here they will be represented as strings of nucleobases with the following convention: LNA-modified bases will be written in uppercase, while unmodified bases will be written in lowercase. Below is an example of an LNA gapmer:
TGGCaagcatccTGTA
Here, TGGC and TGTA are the LNA-modified flanks, and aagcatcc is the ‘gap’ between the flanks with standard DNA sugars.
This introduction relied on Antisense Therapy: An Overview by Shashwat Sharad.
Locked nucleic acids (LNAs).
If we simply produce a short strand of DNA or RNA complementary to a specific RNA, then we run into some limitations. Some of these could be:
- It will be unstable, i.e. likely to degrade; and/or
- It has a poor binding affinity, which makes the binding to the RNA target site weak and unstable.
Therefore the oligonucleotides need synthetic modifications to overcome these limitations. One example is locked nucleic acids (LNAs): a modification to the sugar molecule of the nucleotide. LNA modifications are intended to increase the resistance of the ASO to degradation. LNA also has a big effect on the binding affinity of the ASO, increasing the likelihood that it will attach and stay attached to the target site on the RNA.
For more information on LNA, you can begin with Locked Nucleic Acid as a Novel Class of Therapeutic Agents by R. N. Veedu and J. Wengel.
Toxic side effects.
What features of an ASO contribute to toxicity?
Some LNA ASOs are very effective at reducing the expression of the targeted RNA. However, there is evidence that LNA ASOs can cause liver damage (hepatotoxicity) — Swayze et al., Burel et al..
While such drugs would not be approved for clinical trials, a clear understanding of the mechanism leading to toxicity is necessary to improve the development of safe ASOs.
Preclinical studies have shown that levels of liver toxicity were independent of the gene inhibition caused by LNA ASOs (Swayze et al.). Moreover, replacing a single nucleotide in the LNA gapmer can significantly affect its toxicity (Stanton et al.), meaning that LNA ASO design could be a major contributor to toxicity after all.
People have used machine learning methods to understand the relation between LNA ASO sequence structures and toxicity (Hagedorn et al., Stanton et al., Papargyri et al.). In this blog post, we aim to contribute to these efforts by applying a novel method using symbolic regression: the QLattice.
The QLattice is a symbolic regression algorithm designed to find the simplest mathematical relationship that will explain observations. One can find out more about it here.
In summary, the crux of this blog post will be to try to answer the following question: What features of an ASO contribute to toxicity?
Data.
In our analysis, we used the data from Papargyri et al. The data set contains two sets of iso-sequential LNA gapmers, where the authors of the study systematically varied the number and positions of LNA modifications in the flanks.
Specifically, there are 768 different LNA gapmers, where 386 of them target a region we will call region A, and 386 of them target a region we will call region B. This means the “6mer-gap” is the same within each region and the only variance is in the flanks. Four of the ASOs target neither of the regions and were included in the original study as inactive controls. We will not use those four ASOs in this blogpost.
For the curious: both regions A and B are located on the hypoxia-inducible factor 1-alpha (HIF1A) RNA. “The HIF1A protein regulates cellular responses to hypoxia, and elevated expression of HIF1A has been associated with poor prognosis for many types of cancer.”
In the aforementioned study, toxicity is measured by caspase activation. Caspase is a family of enzymes that play an essential role in programmed cell death.
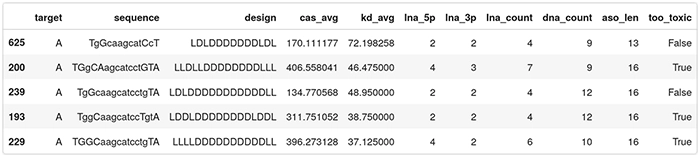
Below are five entries of the data set:
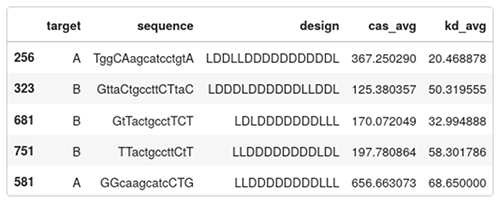
- target: A or B, indicates which region in HIF1A is targeted;
- sequence: the camelcase sequence of the ASO. Lowercase means DNA, uppercase means LNA;
- design: the gapmer design. Each character is either L or D for LNA or DNA;
- cas_avg: the average caspase activation across several measurements. Low caspase means that the ASO is safe, high caspase means that the ASO is toxic. This is a percentage of the baseline levels of caspase activity in a healthy cell; and
- kd_avg: average knockdown. How efficient the ASO is in reducing the targeted RNA. It is expressed as a percentage of the RNA remaining. A low value means an active drug, while a value close to 100 means the RNA wasn’t knocked down by the ASO.
Strategy.
First we will use the QLattice to find a mathematical expression that will serve as a hypothesis for the relation between LNA ASO design and toxicity solely on region A. The key point of a hypothesis is to be able to invalidate it. Along these lines, we will scrutinize this hypothesis by testing whether it generalises to region B.
Previous work has shown that a reasonable threshold for caspase activation is 300% (Dieckmann et al.).
We will use this as the cutoff value for training a QLattice classifier model: below this value the drug is seen as having low/mid levels of toxicity (negative class), while above this threshold the drug is seen as (very) toxic (positive class).
It should be noted that we will not be optimizing for activity (knockdown).
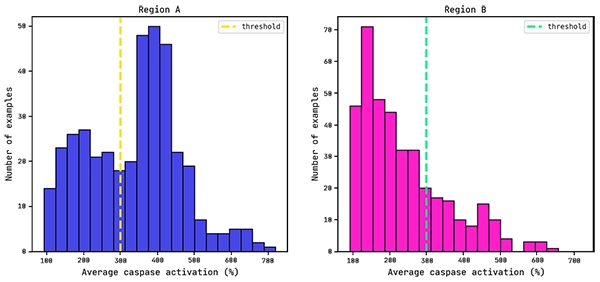
Average caspase distributions for each region.
Since we know that the ASOs targeting each region differ only in where the LNA modifications are, we will be generating a model that explains caspase activation from the LNA/DNA composition only. For example, each ASO targeting region A consists of or is a subset of the following sequence:
tggcaagcatcctgta
Here is an example of another design of the sequence above:
TggcAagcatccTgTA
When it comes to the feature engineering we will count only the amount of upper case (LNA) and lower case (DNA) sugars in the ASO.
Feature engineering.
We will engineer four features that capture some of the LNA ASOs design:
- lna_5p: the number of LNA sugars in the left flank (5′);
- lna_3p: the number of LNA sugars in the right flank (3′);
- lna_count: the number of LNA sugars across the ASO;
- dna_count: the number of DNA sugars across the ASO; and
- aso_len: the length of the ASO.
Note that there is some redundancy here: lna_count = lna_5p + lna_3p. We include it nonetheless to allow the QLattice to choose whether to distinguish between the 5′ and the 3′ end or not.
Here is the final dataset to be fed to the QLattice. Observe this is only on ASOs targeting region A:
Why use the QLattice?
The QLattice is Abzu’s AI algorithm that explores the space of all mathematical expressions that relate the output (toxicity) to the input (ASO characteristics). The result of the search is a list of hypotheses sorted by how well they match observations.
Caspase toxicity is a biological mechanism that is a function of many cellular subprocesses. We engineered some simple features and allowed the QLattice to search through different interactions between them that describe toxicity. The result in the end is not only a predictive model that we can benchmark, but an actual explanation towards the underlying biology that enables us to design less toxic compounds in the future.
In this blogpost, we use the QLattice to generate classification models. Mathematically, this means that the QLattice will wrap each expression in a logistic function. This allows the output to be interpreted as a probability. In other words, if X is an input vector and Y is the event we want to predict, then the QLattice will search for functions f(X) such that the predictive power of

is maximised.
In our case, Y is the probability of an ASO being above the 300% toxicity cutoff value, and f is any function of our input features. Specifically, the QLattice will be searching for the following expressions:

Finding hypotheses for ASO toxicity:
Below is a code snippet of how to search for hypotheses with the QLattice. Here we use Akaike information criterion (AIC) to sort the hypotheses. Also, dfA is the data set of region A we train the QLattice on.
Results:
Here is the best performing hypothesis (graph) according to AIC:
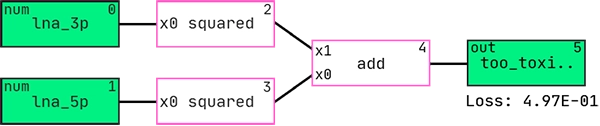
And this is the graph interpreted as a mathematical expression:

Note how the exponent above indicates the equation of an ellipse. This sets the boundary between the positive and negative classes in the two-dimensional plane of lna_3p and lna_5p. We can see this demonstrated below where the colour bar is the probability of the ASO being too toxic.
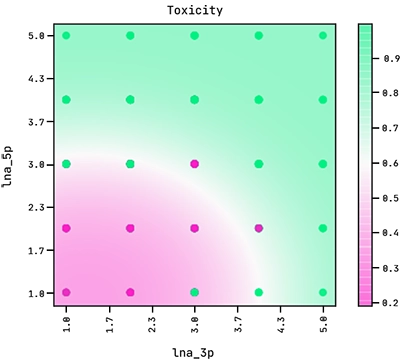
Observe how the amount of LNA modifications in the 5′ flank has a stronger effect on its toxicity than the amount of modifications in the 3′ flank.
Below are the ROC curves of each region with their respective AUC scores:
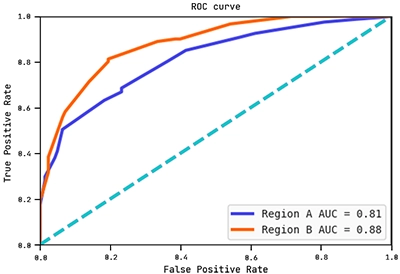
Observe how the AUC score on region B is actually higher than on region A. This shows the hypothesis (graph) above generalises well to region B.
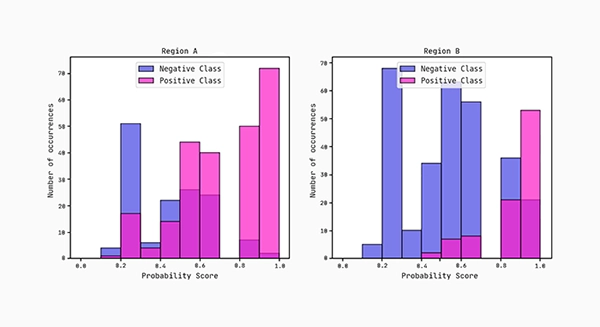
Lastly, we plot the distributions of the predicted probability scores for each region. According to the AUC scores, region B separates more cleanly between the classes compared to region A.
Conclusion:
What features of an ASO contribute to toxicity?
Our hypothesis indicates that the LNA load in the ASO contributes to toxicity. More specifically, it says that there is an elliptical boundary that separates between the positive and negative classes. High toxicity is associated with high LNA count on both flanks (lna_5p ≳ 3 and lna_3p ≳ 4). Furthermore, the good performance on region B added validity to the hypothesis.
To provide further tests to this hypothesis, it would be interesting to perform experiments with LNA ASOs whose sequences are different from the ones in regions A and B.
Note that in our feature engineering process we didn’t discriminate between positions of the LNA modifications in the flanks, we only counted them. This could be a cause to the misclassifications as some positions might contribute more than others. For further study we could investigate whether the position of the LNA modification in the flanks contributes to toxicity.
The details of this work can be seen in the notebook Gapmer Classification analysis.ipynb from this github repository.