Introduction.
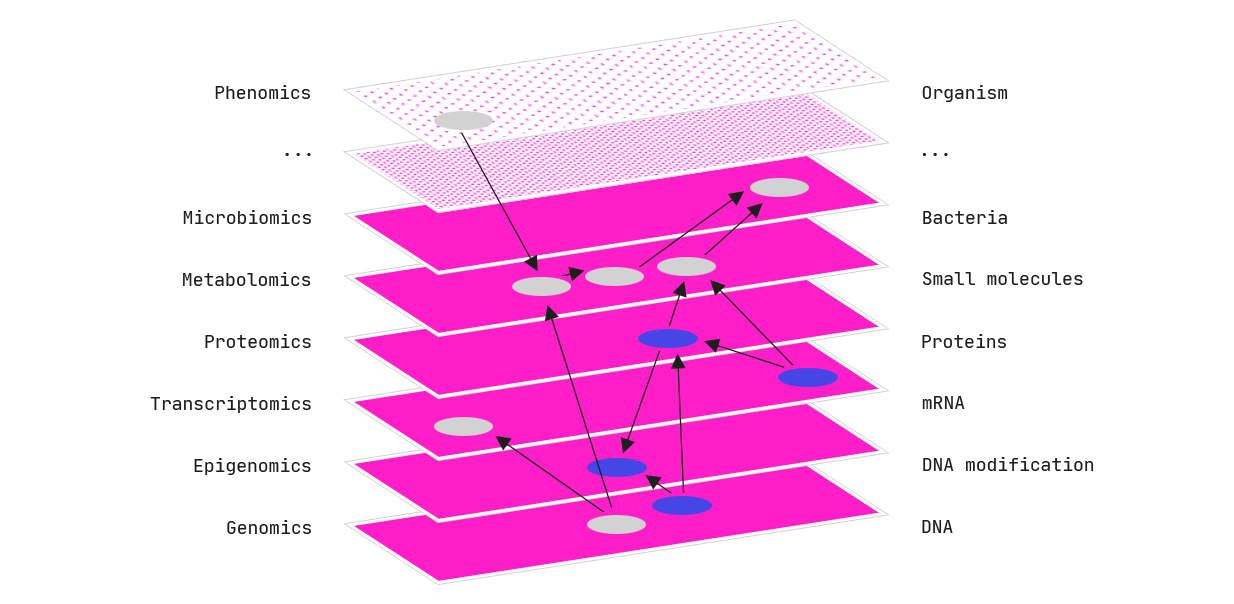
It has become common practice to measure thousands of biomolecules in human subjects, animals, and model systems with so-called “multiomics” methods to uncover novel biomarkers and mechanisms of disease.
Improved technologies have led to increased throughput and a massive reduction in cost per sample. Nevertheless, these measurements are still expensive, and the number of samples in most data sets remains relatively small. This leads to the creation of “wide data sets” that contain many measurements (columns) and only comparably few samples (rows).
Multi-omics data sets.
Machine learning runs the risk of overfitting on wide data.
The information contained in these data is substantial; however, due to noise, it is a non-trivial task to perform advanced modelling and machine learning on this type of data. With many more features than samples, there is a large risk of overfitting the model to the training data, especially with black-box machine-learning algorithms, thus not being able to predict outcomes on unseen data.
Linear models are robust but compromise on performance.
Linear models and simple t-tests have long been the golden standard for analysing such data. These approaches ensure the interpretability and robustness of the predictions. The caveat of this approach, though, lies partly in the large number of genes or other omics type features that result from, for example, a traditional differential expression analysis. This is a result of highly correlated features and leaves the experimentalist with the often-overwhelming task of reasoning about the omics features and typically requires follow-up processing (such as enrichment analysis).
Where would you start looking for solutions in a nearly infinite space?
The QLattice as a solution.
Abzu is exploring a third approach that balances simplicity with performance, delivering graph-based models with high interpretability. Inspired by quantum-field theory, the algorithm (the QLattice®) efficiently searches an approximated infinite list of relationships between your features to identify meaningful patterns in the data.
The resulting set of models (linear or non-linear) contain a handful of features that are connected by simple functions (e.g., add, multiply, log, gaussian, etc.). Due to their simplicity, they typically generalise extremely well to unseen data and often outperform other black-box machine-learning methods. Occam’s Razor in action!
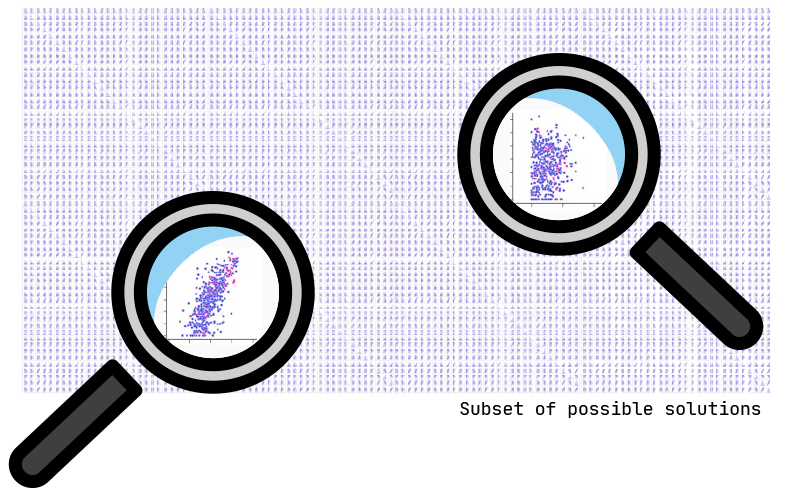
Where would you start looking for solutions in a nearly infinite space?
Predicting and understanding breast cancer deaths.
A common question in a clinical setting is: “What is it about certain patients that biases them towards a bad outcome?” or “how do we know whether the drug will work on a certain patient group or not”?
Consequently, a lot of work is being put into identifying ways of predicting these outcomes by measuring certain biological or physiological signals. These so-called “biomarkers” can help to catch diseases early and guide us towards certain treatment strategies with increased success rates. Omics technologies are one of the most common tools for measuring thousands of molecules in biological samples simultaneously.
The multi-omics data set.
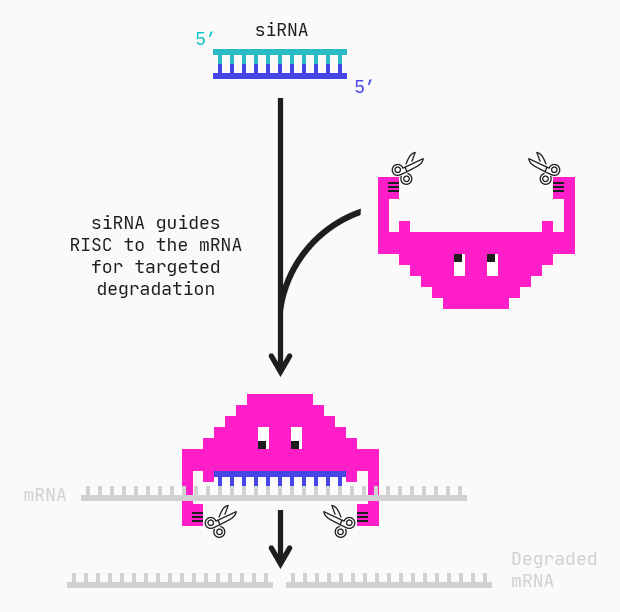
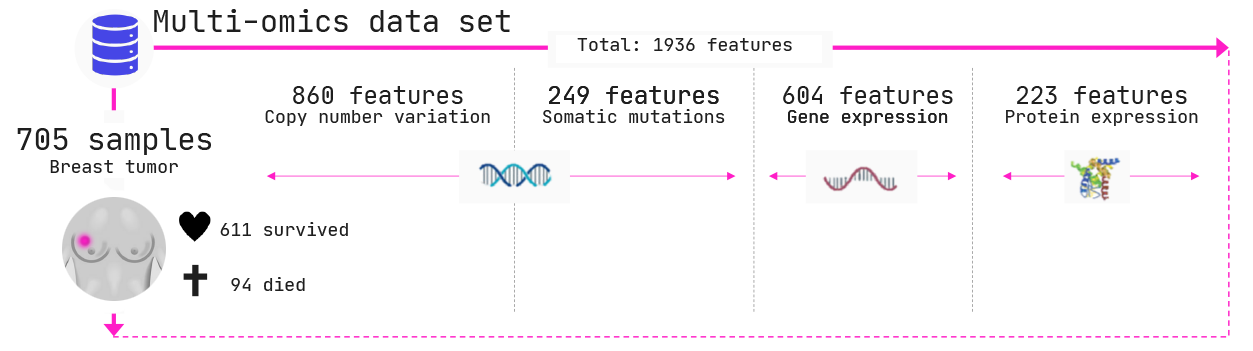
In the below example, we explored a breast cancer cohort of 705 women. 94 of these women died of their cancers and 611 survived. Biopsies were taken of each of these women and four different types of measurements were performed across three different biomolecules, namely
- Copy number variations (DNA); i.e., how many copies of each gene does the cancer have
- Somatic mutations (DNA); i.e., whether the cancer has mutated in a given gene,
- Gene expression (mRNA); i.e., how much is a certain gene being expressed, and
- Protein levels; i.e., how much protein has been produced by a certain gene.
In total we have 1936 features (columns in the data) across 4 omics types.
Note: the data set includes breast cancers of two different origins, called lobular and ductal breast cancers. Reference: Ciriello et al. 2015, https://www.cell.com/cell/fulltext/S0092-8674(15)01195-2.
Can we reveal the molecular signatures that the women with poor outcomes have in common and can we use this information to predict who will have poor outcomes?
Starting simple.
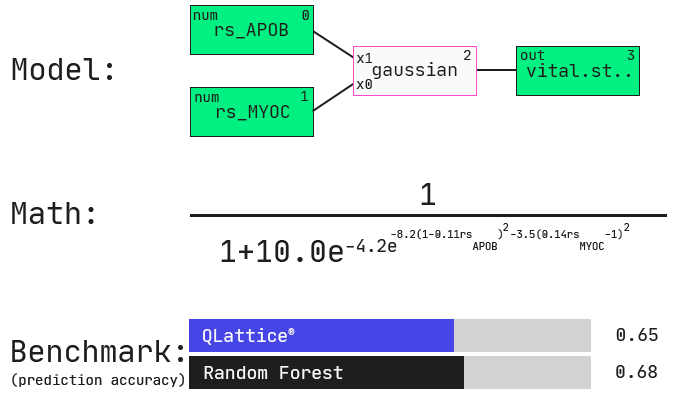
One of the first models that comes out of the QLattice is a simple two-feature model with a non-linear interaction. Specifically, the QLattice identified a high-performing model that relates two gene-expression features with a bivariate gaussian function. What does this mean? Let’s first look at the QLattice model and see how it compares in performance to a generic random forest model.
Keep in mind that we have nearly 2000 features (columns) in our data. Depending on how many features you want in your model, the combinatorial space of all possible permutations of features and functions becomes intangible very quickly.
The impressive thing here is that we did not tell the QLattice explicitly how many features to include. All we did was penalise complexity: any additional feature added to the model must hold substantial signal for it to even be considered. Similarly, non-linear functions are penalised more than linear interactions.
This also means that highly correlated features will likely not appear together in your model. If one feature is sufficient to explain the majority of the signal of 100 others, then the QLattice will only use that single one. The performance will be the same and you’re much less likely to overfit.
Let’s take a look at the decision boundary of the model.
Revealing the model’s decision boundary.
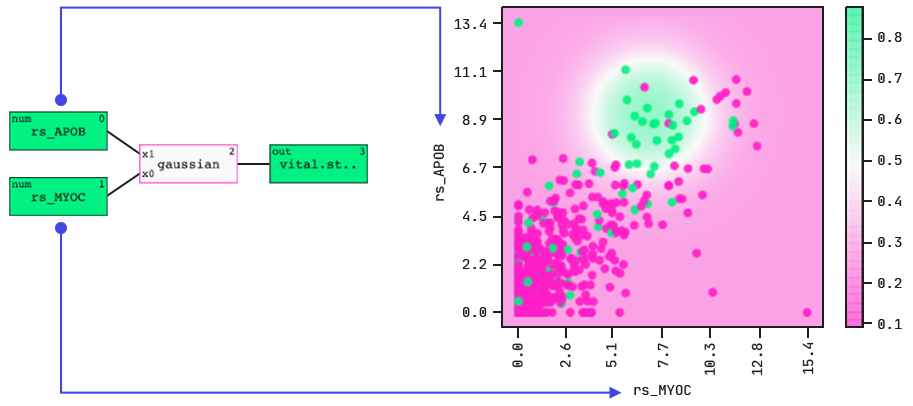
The colouring indicates death (green) and survival (purple).
The model identifies a “hotspot”, i.e., a range of expression levels in two gene-expression features that together indicate the outcome. Note: the colouring indicates death (green) and survival (purple).
When we dig a little deeper into this highlighted population, we find that there was an enrichment in ductal over lobular cancers. There seems to be something about these two gene-expression features (and their correlated genes) that in ductal breast cancers leads to poor outcomes.
Multi-omics modeling.
Information in biology is distributed across biomolecules. If we can model these different levels of molecular hierarchy (DNA -> RNA -> protein) in a meaningful way, we are more likely to capture the underlying molecular mechanisms.
The QLattice draws features from mixed data types to build multi-omic models. Typically, we find that these models lead to higher performance than models with only a single omics data type.
Here’s one multi-omic model that the QLattice finds in this data set:
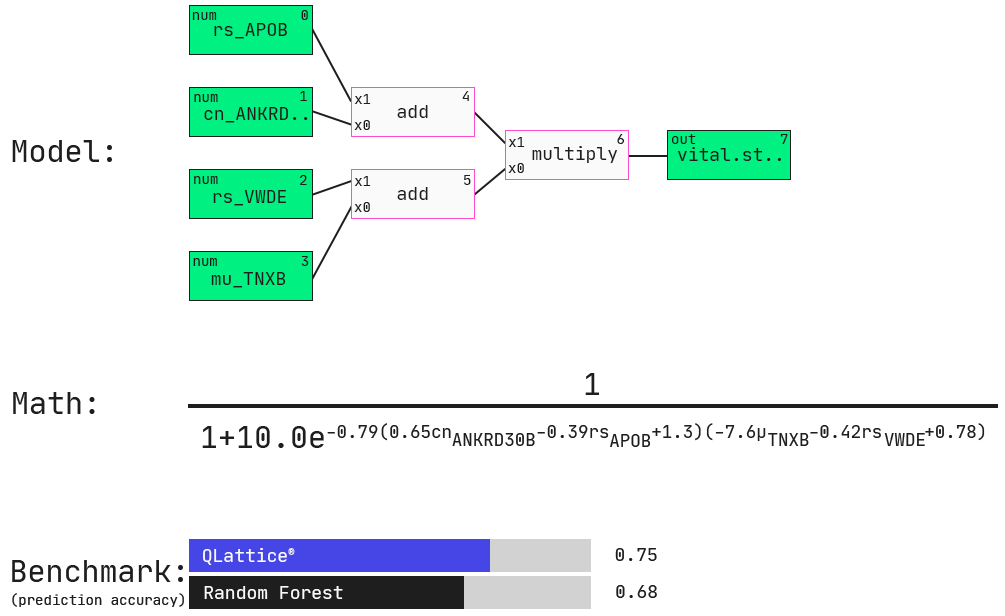
Here, the QLattice finds a four-feature multi-omic model, again with APOB as seen in the simple model above.
Now, another gene expression feature is added, namely VWDE. Other features include somatic mutation (mu) in TNXB (i.e., is a mutation in the gene present or not) and copy number variation (cn) of ANKRD (i.e., how many copies of the gene are present in the cancer). These features are connected through additions and a multiplication as shown in both the graph representation and the mathematical expression of this model.
We will explore these associations in partial plots below. On a side note, this model performs favourably to commonly used machine-learning models built for prediction accuracy, not interpretability (in this case a Random Forest model).
A genetic switch.
The multi-omic model includes a binary feature, namely mu_TNXB, which indicates whether the breast cancer was mutated in this gene or not. This feature acts as a switch in the model: whenever it’s a 0 (no mutation) or 1 (mutation present), the prediction changes accordingly. Let’s look at these two scenarios in the following partial plots and decision boundaries.
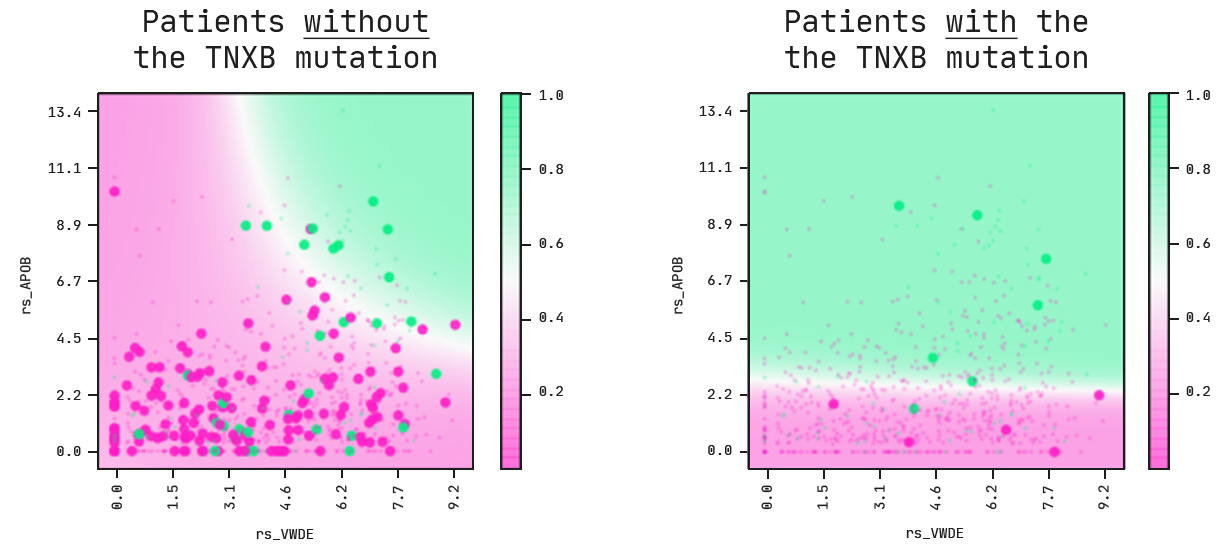
On the left, we’re looking at patients with breast cancers that do not carry a mutation in the TNXB gene. For these cases, the model tells us that a combination of high APOB and VWDE expressions leads to a higher probability of death.
This picture changes whenever we look at patients with breast cancer that do have a mutation in TNXB. On the right, the VWDE feature becomes obsolete. The associated risk is not dependent on the expression level anymore and a higher expression level of APOB is now the main risk driver for patients.
Note that what we are doing here is hypothesising: a starting point for new questions. Thus, is there something about the TNXB gene that when mutated exacerbates the risk of dying from breast cancer? After a quick literature search, we found that TNXB has been shown to be a promising biomarker for early metastasis of breast cancer [Hu, Xiaofang, et al. OMICS A Journal of Integrative Biology 13.4, 2009].
The data set and code are available in this kaggle notebook.
Perspective.
The QLattice yields high performance and interpretability on multi-omics and other mixed data types. It is especially strong at dealing with multicollinear data and delivering simple models with high performance. This makes the QLattice a unique tool for discovering new biomarker signatures and designing diagnostic assays based on only a few highly potent biological and clinical features.
The strong performance on unseen data makes the QLattice an attractive choice for researchers and data-driven decision makers who are looking for robust and trustworthy predictions and insights.