Introducing a new machine learning tool: The QLattice.
Introducing the QLattice: Fit an entirely new type of model to your problem. The QLattice graph is neither a neural network nor a decision tree-based model. You could say that the QLattice unpacks the black-box neural network and serves explainability/interpretability similar to that of a decision tree.
Before jumping into the practicalities, let’s have a look at a QLattice graph:
How does the QLattice work?
The QLattice searches among thousands of potential models for the one graph with the right set of features and interaction combinations that, in conjunction, unfolds the perfectly tweaked model to your problem.
The data transformations accessible in the QLattice are: multiply, linear, sine, tanh and gaussian — together these cover virtually all natural occurring dependencies.
This means that a well trained QLattice graph will extract whatever signal your features hold when predicting your target variable.
However, the real beauty of it all is not the high accuracy of your model. It is that you have a simple visual depiction of your model.
You can inspect in great detail how your data is manipulated to ultimately deliver a set of predictions. Nothing is hidden away in a hidden layer in your neural network or in the 117th decision tree in your ensemble model.
I would go to the lengths of saying that the QLattice graph is your best shot at describing the true model of your data, the actual data generating process.
Intrigued? You can use a community QLattice for free for non-commercial data sets.
How to use this new machine learning tool?
Apply your QLattice.
In this tutorial, we will go through the basic workflow of how to solve a regression problem using the QLattice.
Feyn® (/ˈfaɪn/) is the software development kit that we use to interact with the QLattice. It is named after Richard Feynman, as his work on path integrals made the QLattice possible.
Let's try it out!
Finding some random, continuous target, machine learning dataset on Kaggle…
A typical machine learning problem: Airbnb rentals! What’s the right price for your apartment on Airbnb in New York (Kaggle). This dataset has a good mixture of continuous and categorical features to showcase (and we can give you a nice map visualisation of our results at the end). Let’s go!
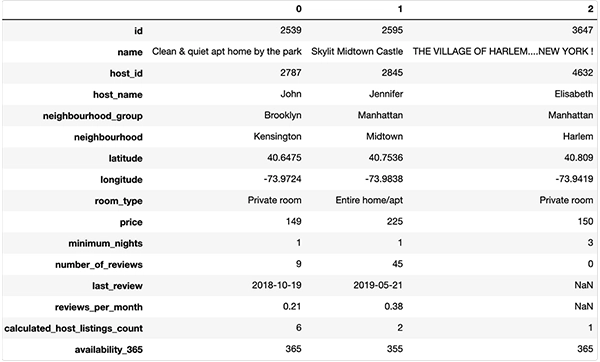
So we’re predicting prices based on type of rental, location, review, host popularity, and historic availability information.
For this blogpost we will gently skip the lengthy data exploration and feature engineering tasks (the importance of which of course can’t be overstated — however they are not the point of this blog post). A minimal pre-processing effort is needed though, namely removing unique identifiers and irrelevant features. The same goes for NaN values and extreme outliers.
Data ready — let’s split it. For now we will do with a train and test set.
Waking up the QLattice: Your new machine learning tool.
Now we are ready to play. We first call a QLattice, your new machine learning buddy.
To continue we need to tell the QLattice what are the inputs and outputs of the models it produces.
We will assign each variable in the dataset to a semantic type — are we dealing with numerical or categorical values? By default each variable will be assigned as numerical and expect numerical values, so we only point out the categorical variables:
With this feature categorical variables are automatically encoded in the QLattice. Did you hear that? No more handheld one-hot or similar encoding of categorical features! It’s taken care of in the categorical register. Likewise the numerical register automatically scales the data to be between [-1,1] with the MinMaxScalar standardisation. If you have specific scaling wishes, you can intervene and do the numerical scaling yourself.
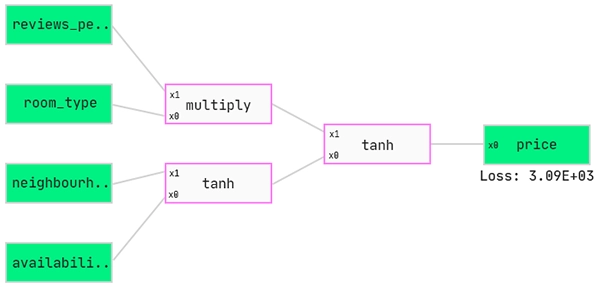
How to read a QGraph®:
Let’s put our QLattice to work. The main thing the QLattice does is produce QGraphs. A QGraph is a collection of all possible models connecting input to output. However, due to compute as well as memory limitations, the QGraph cannot hold all possible models and so in practical terms is a subset of the infinite list of models (usually a couple of thousands of models).
We need to tell the QLattice what should be the inputs and output of the model. We include all the variables into the method below and then declare which one will be our output.
Let’s show you some random, un-trained models.
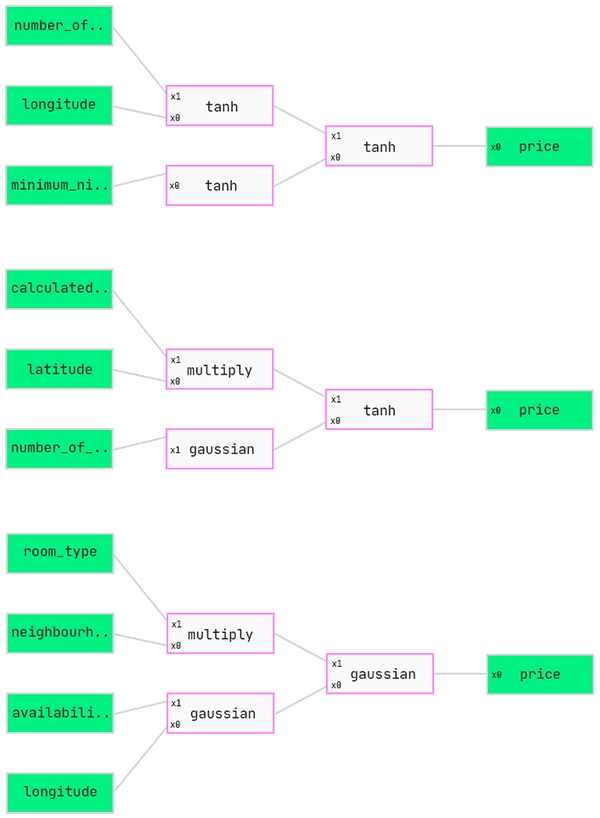
Each model has two types of boxes. The green ones are either input or output and the pink ones are what we call interactions. An interaction takes in a value, evaluates a function at that value, then moves it to the next interaction.
These models are sort of similar to a neural network but with fewer nodes and not the typical type of activation function on the node. For now we apply multiply, linear, sine and gaussian functions along with the typical tanh function.
Each model has a natural flow from left to right, so we feed each row of our dataset into the input, evaluate at each pink box and then produce a prediction at the end at the output.
Fit.
Like a neural network or any other machine learning technique, each of these models needs to be trained. The weights on each interaction are initially random so it is likely that all of the models you see above are just terrible.
The QGraph fit method needs to take the following arguments:
- The data the models in the QGraph should be trained on
- The loss function we want to optimise for
As we are in a typical regression problem we will use the standard mean squared error loss.
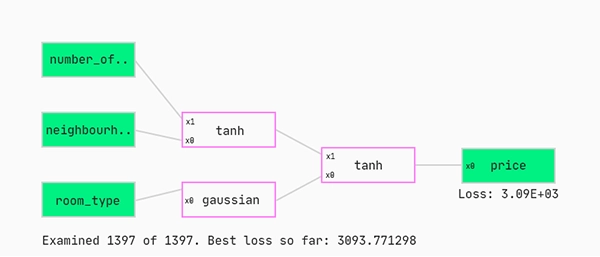
So what is happening here? We train each model in the subsetted QGraph. At any given time during fitting the graph displayed is the model with the lowest mean squared error loss.
Sort.
Let’s have a look at the best ones so far. We do this by using the sort function. The sort function orders the models based on some criteria which we are free to choose. Let’s stick to the standard case; we want to sort the models based on the loss on all of the training set.
Update.
So what if none of the initially extracted couple of thousands graphs match the true model? Obviously, we are not done yet. Updating is the answer. When we update the QLattice we push forward the best learnings to influence the next draw of graphs from the QGraph — we skew the next extraction of graphs towards the characteristics of the graphs that led to the lowest loss in the former set of graphs.
Now we are ready for the next draw of graphs from the QGraph. Let’s move on with 5 more updates in an iterative fashion as shown below.
Fit, sort, update, repeat…
… until your loss has not decreased for a while (or you just don’t want to go on anymore).
Predict.
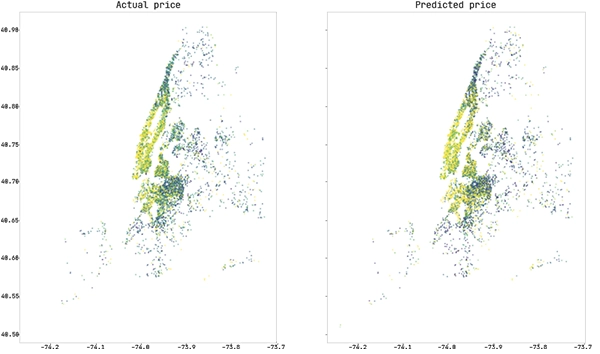
Let’s see what we’ve got for our efforts. We can predict the prices in our test set by running the predict method on our graph.
And to finish off with glitter: Pouring actuals and predictions over the longitude latitude span of New York City.
With this introduction to solving a regression problem with a QLattice, we hope you have gotten the broad idea of what a QLattice is all about and that we have sparked a further interest. If so: Go and play around with a community QLattice!