Can we predict siRNA activity with AI?
Our results-driven world pressures us to dangerously cut corners. The use of black-box AI in drug R&D is a prime example of this. The underlying problem is simple: we have become so wrapped up in the race to make the most accurate predictions — of effective molecules, of disease biomarkers, of toxicity, of side effects, the list goes on — that we are willing to give up understanding how these predictions arise. In doing so, we give up good science.
Why does the use of black-box AI force us to give up trying to understand the underlying mechanisms hidden in data? It’s due to an inherent characteristic: while good at making predictions, black-box-generated models are uninterpretable to us. Black-box generated models don’t tell us what mechanisms or relationships between features in our data are interacting to make these predictions. This means we aren’t learning anything about our data. This stunts scientific discovery.
If we want good science in AI-driven drug development, or any other kind of research for that matter, we need to reemphasize developing our understanding of underlying mechanisms as we make predictions. So let’s reposition ourselves.
We are not a blind cog in an industrial drug discovery pipeline, we are the informed driver of discovery.
It’s not about asking ourselves, “How good can we get at predicting”, but rather “What is the best way to interpret what is going on here?”. In doing so, we get back to the core values of science and avoid the pitfalls of blind acceptance.
AI with explainability.
So if black-box AI is not a suitable tool for this type of mindset, what is? Here we turn to the QLattice — an explainable AI that produces mathematical models that show how specific features interact to predict the target. The QLattice gives us explanations with predictions. Analyzing these explanations helps us understand what’s really going on in the data.
Using explainable models to gain knowledge about siRNA activity.
Gene inhibition in RNA therapeutics.
Let’s apply our repositioned selves and the QLattice in a very hot area of research: nucleic acid-based medicines. One particular type, RNA interference (RNAi), involves a process by which specific mRNAs are targeted and degraded. Taking advantage of naturally occurring degradation mechanisms allows us to inhibit the expression of specific genes. As you can imagine, this is an interesting drug mechanism for many diseases and disorders, ranging from cancer treatments to the mediation of genetic disorders.
There are a few RNA types with slightly different mechanisms to accomplish RNAi; however, here, we will focus on the siRNA approach.
The siRNA mechanism.
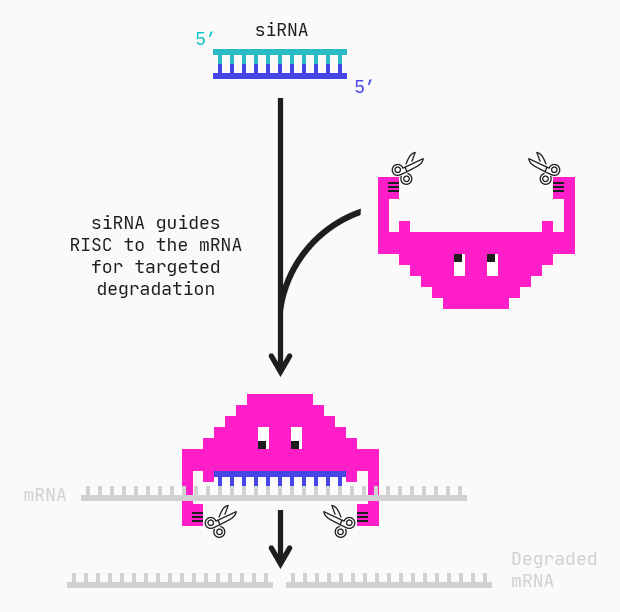
siRNAs, or short interfering RNAs, are double-stranded oligonucleotides of around 20–30 base pairs. Together, the two strands form a duplex consisting of a passenger and guide strand. The guide strand of the siRNA combines into the RNA-induced silencing complex (RISC) and guides the complex to the mRNA via complementary base pairing. RISC can then degrade the target mRNA preventing its translation into disordered or undesirable proteins.
A siRNA is much shorter than its mRNA target. Therefore there are many different siRNA “candidates” for the same target.
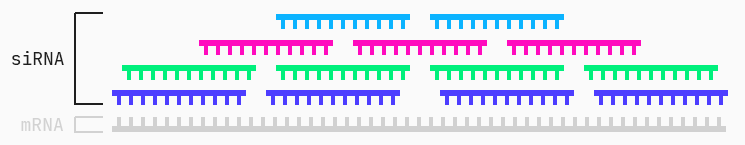
However, not all of these siRNAs induce gene silencing, or minimal expression of the undesirable gene. In other words, while a group of different siRNA candidates target the same mRNA, not all are actually effective at inhibiting its expression. We can then ask ourselves: are there specific characteristics or features of a given siRNA that can predict its gene silencing potency? Furthermore, how do these features of interest interact to create a mechanism for determining effective siRNAs? We will use the QLattice to answer these questions.
The data.
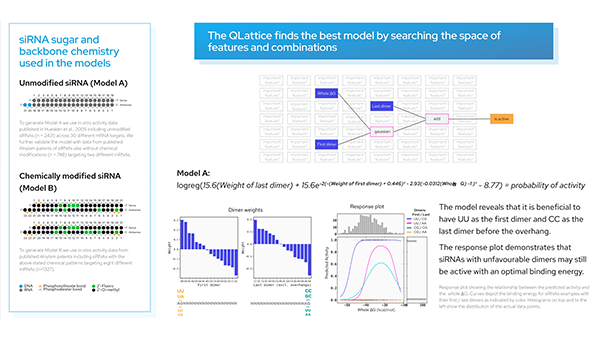
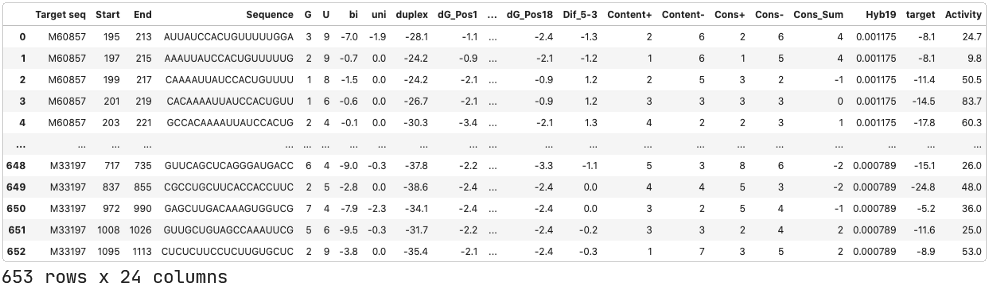
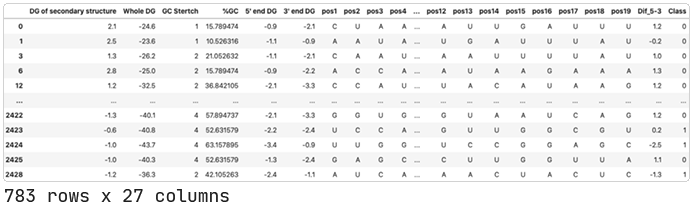
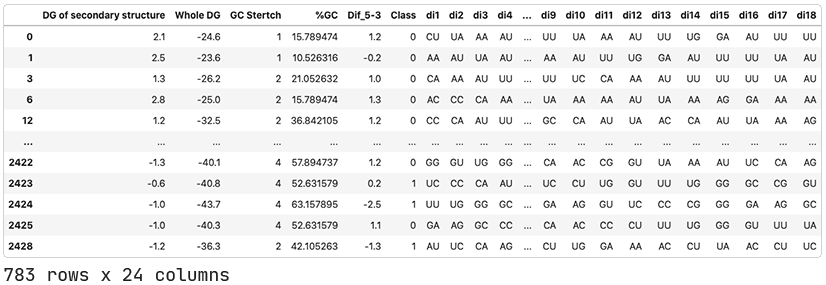
We will use data published by Shabalina et. al. (2006). This dataset includes siRNAs targeting 52 different mRNAs with at least 5 different siRNA per target. Each data entry includes information about the target mRNA, the siRNA sequence, composition and thermodynamic characteristics of the oligonucleotide, and the associated siRNA activity.
Pre-processing.
While the dataset has activity data, these values are numerical. However, we will analyze siRNA activity as a classification problem: we want to predict active versus inactive siRNA, not their specific mRNA inhibition values. This is because there can be various target or assay-specific features that impact the measured activity. These would be a big hurdle to overcome if we were to analyze and predict the specific activity values in a regression problem. Furthermore, Shabalina et al. also performed a classification.
To perform this analysis, we first classify each siRNA as active, inactive, or neither, according to the method described in the paper. If mRNA expression is at 30% or less after the siRNA treatment, i.e. the RNA expression is inhibited by 70% or more, then the siRNA is considered active. Conversely, if the RNA expression is 70% or more after the siRNA is introduced, i.e. the RNA expression is inhibited by 30% or less, then the siRNA is considered inactive. We will add a column called ‘Class’ to the data. In this column, active siRNAs will be denoted with a 1 and inactive with a 0. siRNAs that exhibit between 30% and 70% silencing capabilities will be considered too ambiguous to be classified. We will drop these.
Finding a model using the QLattice.
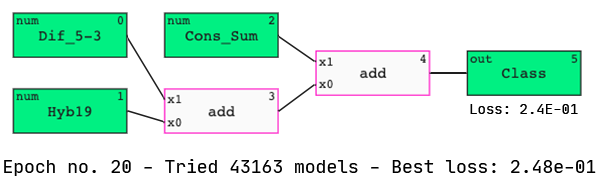
In the associated paper, Shabalina et al. used neural networks to identify the four most powerful predictive features of siRNA activity. They identified Cons_Sum, Content-, Hyb19, and Dif_5–3 as the four “best” parameters out of the total 18.
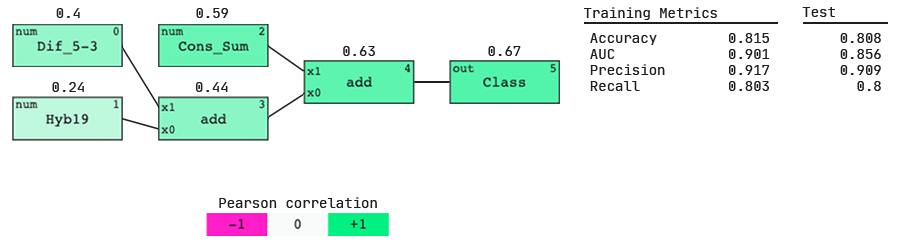
Interestingly, we see three of these features in our model. Let’s analyze its performance.
Understanding the features.
The QLattice has identified three important features and a simple interaction between them, but what do these features mean?
Cons_Sum
This is a compositional feature and is a numerical representation of which position-nucleotide combinations are preferred and avoided. In other words, at specific base locations, active siRNAs may typically have specific nucleotides (a preferred combination) or typically not have specific nucleotides (an avoided combination). Cons_Sum is calculated by subtracting the number of preferred — avoided nucleotides.
Dif_5–3
This is a thermodynamic feature that measures the difference in free energy of the sense-antisense strands of the siRNA. It takes the binding energy (∆G) at the 3′-end minus the binding energy at the 5′-end.
Hyb19
This feature describes the frequency of potential targets for a siRNA along the target mRNA.
Adding more descriptive features.
As we saw, Cons_Sum is a summary describing avoided and preferred nucleotides at specific positions in the nucleotide sequence of the guide strand. What specific nucleotides these are, whether they are avoided or preferred, and whether the preference is stronger at specific positions are important questions whose answers are lost in this attempt to represent these preferences with one summarizing value. The QLattice, however, can handle a combination of numerical and categorical data. This allows us to pass categorical descriptors of the nucleotides present at each position of the siRNA. The QLattice will then point us to important positions in the guide strand where specific nucleotides are avoided or preferred and tell us what these are.
To perform this analysis, we’ll need a bigger dataset. We’ll take the one used by Ichihara et al. (2007). This includes the oligonucleotides analyzed by Shabalina and colleagues, as well as others from other researchers. We’ll add the positional features and Dif_5–3 ourselves.
Classifying the sequences.
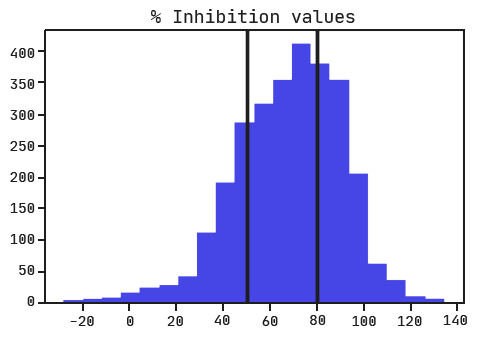
Ichihara and colleagues performed a regression analysis on the data and didn’t give us thresholds for determining active, inactive, and ambiguous siRNAs. With no guide, we’ll have to set them ourselves. Looking at the distribution of inhibition values, it would make sense to consider active siRNA as those with an inhibition greater than 80% and inactive as those with inhibition less than 50%. Note that the ‘% Inhibition’ column represents how much the RNA expression was inhibited with a higher value indicating a more active siRNA (the opposite of what we saw with ‘Activity’ in the Shabalina et al. dataset).
Train/test split & data preprocessing.
The researchers tell us which siRNAs they included in their train (A1600) and test (A831) sets. We’ll use the same train/test split and call the datasets dataA and dataA2 respectively.
Declare the type of input data.
We touched on this earlier, but the QLattice can work with a combination of categorical, numerical, and boolean data. However, it automatically assumes the data being passed is numerical, so we have to specify that the positional features we’ve added are actually categorical. The input data type is called its semantic type, and we’ll keep track of the columns we identify as containing categorical type data in a dictionary called ‘stypes_pos’.
Using the QLattice.
Now we are ready to generate a model.
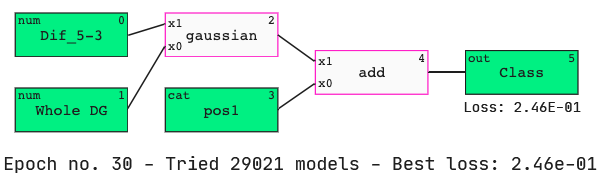
We see that the nucleotide at position 1 has been identified as an important feature when determining active siRNAs. We also see that Dif_5–3 has appeared in our model again.
Evaluate performance.
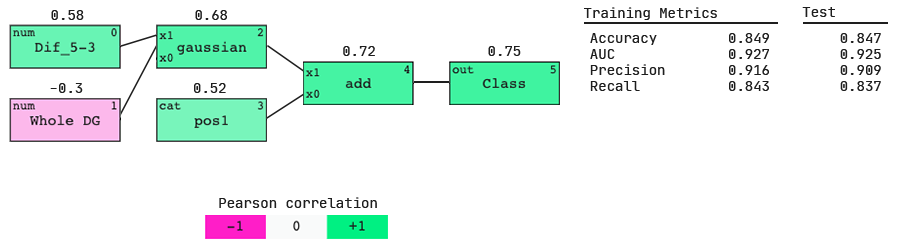
Nucleotide preferences from weights of categoricals,
The positive value above the pos1 node shows that position 1 is positively correlated with the output. Therefore the largest positive categorical weight will tell us the most preferred nucleotide.
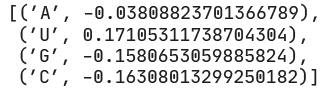
We see that at position 1, U is most preferred, followed by A, then G and C as (relatively) equally the least favorable.
Model response to Dif_5–3.
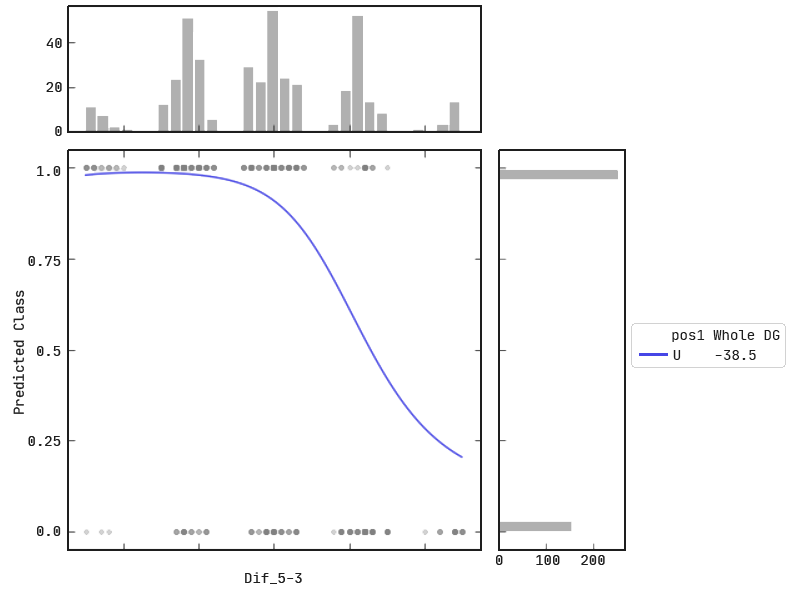
The plot depicts the predicted ‘Class’ of a siRNA according to its Dif_5–3 value (at a constant Whole DG value and pos1 nucleotide ‘U’). We see siRNAs with smaller Dif_5–3 values are more likely to be predicted as active, and the converse for siRNAs with higher Dif_5–3 values.
Painting a more detailed picture: telling the story of active siRNAs.
What insights about active siRNAs can we gain from the model and shown plots? We see from the response 1D plot above that a more negative Dif_5–3 value indicates active siRNAs. We know that this feature represents the binding strength at the 3′-end of the guide strand minus the binding strength at the 5′-end. We also know that if the binding is tighter it will have a larger negative ∆G value. Therefore, the preference we see for a smaller (more negative) Dif_5–3 value entails that active siRNA have a loosely bound 5′-end and tightly bound 3′-end (larger negative value of 3′-∆G — smaller negative value of 5′-∆G = relatively larger negative Dif_5–3 value). The double negatives here can be tricky. Here’s an image to wrap your head around what we mean.
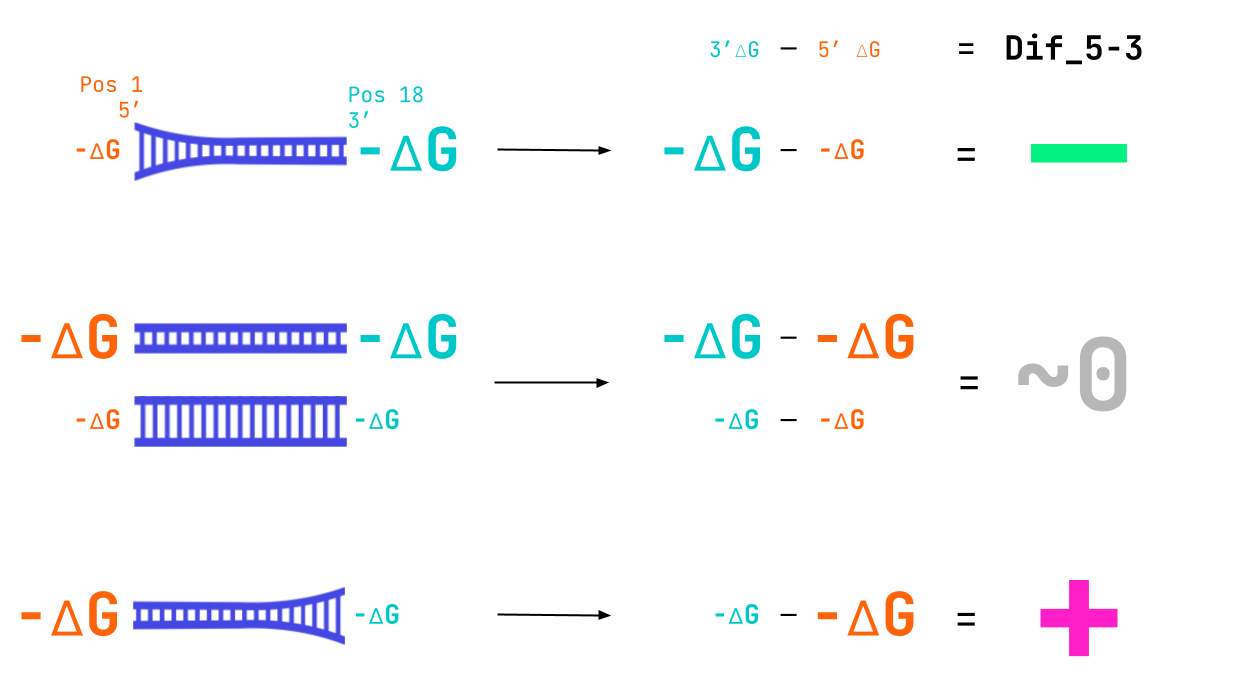
A combination of tight binding at the 3’ end and lose binding at the 5’ end leads to the large negative value of Dif_5–3 seen in active siRNA.
In addition, we know that position 1 is at the 5′-end of the guide strand, and position 19 is at the 3′-end. It is also known that GC-rich sequences lead to tighter binding, and AU-rich sequences lead to looser binding. Therefore, from Dif_5–3, we expect that A and U at position 1 are favorable since it would lead to loose binding at the 5′ end. This is exactly what we see with the categorical weights ranking U and A as the most favorable and G and C as the least preferred at position 1.
Essentially the model has pointed two fingers at the importance of a large difference in the binding tightnesses at the two ends of the siRNA for activity. Directly by including Dif_5–3 and indirectly by pointing to position 1 — the 5′ end of the siRNA where dinucleotide content leads to tight or loose binding — as important.
Digging deeper.
In fact, it is dinucleotide content at the two ends of the strand that really leads to dramatic differences in binding affinities, not simply singular nucleotides. So the statement that U and A are preferred at position 1 because it leads to looser binding at the 5′ end is not an incorrect statement, but it doesn’t capture the whole picture. Yes, U or A at the first position is more favorable, but this is because A/U-rich dinucleotides (AA, AU, UA, UU) are more favorable. Similarly, G and C at the first position are still unfavorable, but because G/C-rich dinucleotides (GG, GC, CG, CC) are unfavorable.
You shouldn’t just trust this statement. We can test this claim by introducing positional dinucleotide features to the data. Think of this as a way of further testing our proposed mechanism where the balance between 3′ end and 5′ end binding tightnesses is a lead indicator of active siRNA.
Data prep.
Again, we’ll train and test on the same data subsets as the researchers. We’ll also perform the same data preparation steps as earlier.
Finding a model.
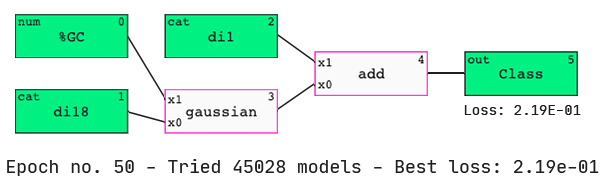
As hypothesized, the QLattice has identified that the dinucleotides present at the two ends of the guide strand are important predictors of dinucleotide activity.
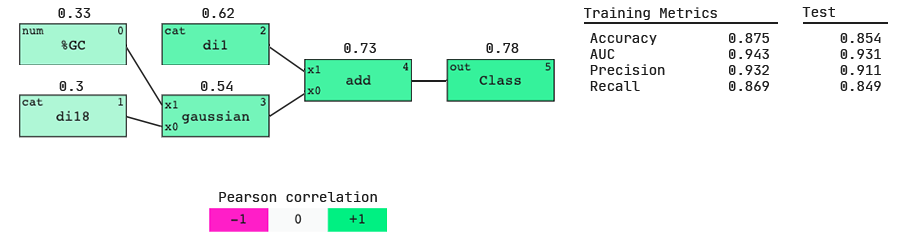
We see that the AUC scores (both on the train and test sets) are higher for this model; we have gained more predictive power by including dinucleotide features. This hints that more information about siRNA activity lies in the dinucleotides present at the beginning and end of the sequence than in the single nucleotides present.
Favorable dinucleotide combinations.
Again we can use the categorical weights to determine preferred and avoided dinucleotides at positions 1 and 18. Both ‘di1’ and ‘di18‘ are positively associated with class, so the larger the associated weight, the more favorable. In the plots below, the dinucleotides are ordered from most to least preferred.
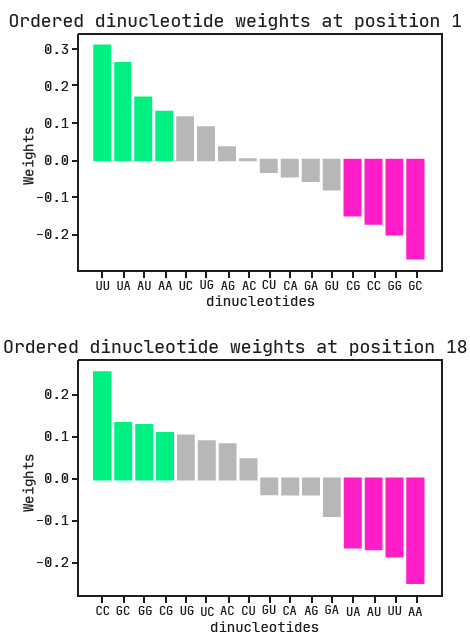
The combination of A/U-rich dinucleotides at the first position with G/C-rich dinucleotides at the last position is the biggest indication of active siRNA. This is exactly what we expected to see, given our previous model and the researchers’ findings.
In summary: An exploratory workflow.
Here we have explored how the QLattice can act as a companion in hypothesis-driven exploration. We were able to use our early models as a compass for where to investigate further. From the features we saw in these, we were able to strategically add more interpretable features that captured the same mechanisms. In doing so, we uncovered a significant attribute of active siRNA: having a loosely bound 5’ end and tightly bound 3’ end. Furthermore, we’ve described how this can be achieved via specific combinations of nucleotides at the two ends of the siRNA. We could’ve stopped after the simple initial model, but with a limited understanding of its features, it would be difficult to draw the same conclusions and interpretations. What a shame that would be!
References:
Ichihara, M., Murakumo, Y., Masuda, A., Matsuura, T., Asai, N., Jijiwa, M., Ishida, M., Shinmi, J., Yatsuya, H., Qiao, S., Takahashi, M., & Ohno, K. (2007). Thermodynamic instability of siRNA duplex is a prerequisite for dependable prediction of siRNA activities. Nucleic acids research, 35(18), e123. https://doi.org/10.1093/nar/gkm699
Shabalina, S. A., Spiridonov, A. N., & Ogurtsov, A. Y. (2006). Computational models with thermodynamic and composition features improve siRNA design. BMC bioinformatics, 7, 65. https://doi.org/10.1186/1471-2105-7-65