The simplest way to think about binary classification is that it is about sorting things into exactly two buckets. (Note: if you sort into more than two buckets, it’s called multiclass classification).
Imagine you are a doctor and have a set of ten patients. You want to decide which of these patients have, say, influenza.
Now, imagine that you have two separate buckets: one labelled influenza and the other labelled not-influenza.
You look at each patient in turn, and if you think the patient has the flu, you put them into the influenza bucket; if not, you put them into the not-influenza bucket. (Or perhaps you just put the patient’s medical journal into the buckets, unless the buckets are really big).
In performing this task, you classify the patients according to some criteria. The doctor might use her intuition, but a computer system could be more systematic.
Learning a binary classifier.
Computers can learn to do binary classification. The best-known but very limited method is called logistic regression.
More recently, many different machine learning methods have been developed to do the job better than logistic regression.
Here is how it works: Consider the following data set of patients. For each patient, we know the body temperature (here in degrees Celsius) and whether the patient has influenza. Now, if we feed this data set to a computer and tell it to learn to classify patients, it will build a so-called model, which can then be used to classify other patients.
| Name | Temperature | Flu |
|---|---|---|
|
Ernest |
37.3 |
No |
|
Louise |
37.6 |
Yes |
|
Anna |
37.9 |
Yes |
|
Henrik |
37.4 |
No |
|
Elise |
37.2 |
No |
|
Irene |
38.8 |
Yes |
|
Casper |
36.7 |
No |
|
Michael |
39.5 |
Yes |
|
Rashid |
38.0 |
No |
|
Erik |
36.9 |
No |
Have a look at the data. Can you learn how to classify patients based on this data?
You probably notice that patients with a low body temperatures tend not to have influenza. In contrast, patients with high body temperatures tend to have influenza, but it is not clear where the boundary is.
Louise, for example, has influenza, although her body temperature is only 37.6°C, while Rashid, with a body temperature of 38.0°C, does not.
So how to deal with that?
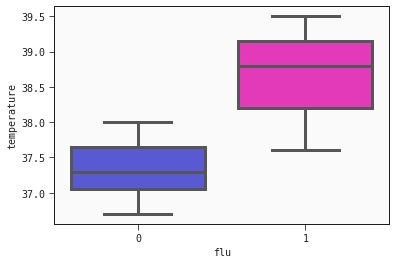
A boxplot showing the body temperatures of the patients with and without influenza. Notice that the arms of the boxes overlap.
Classification with probabilities.
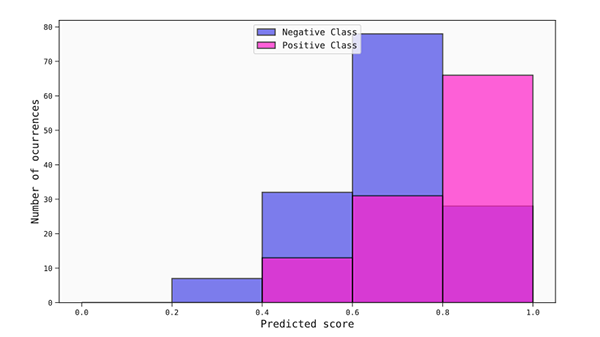
The answer is to use probabilities. A computer model for binary classification will typically return a probability of the patient having influenza between 0% and 100%.
Given this data, the computer model might, for example, learn that a person with 36.8°C degrees has a 5% probability of having influenza while a patient with 39.2°C has an 87% probability of having influenza.
And a patient in the middle, say with a temperature of 37.6°C, has a 50% probability of having influenza.
From probabilities to buckets.
So, if binary classification is about putting things in buckets, we also need to know how to go from these probabilities to an actual decision about which class (or bucket) the patient belongs to.
The most straightforward answer is that if the probability of having influenza is less than 50%, we put the patient into the non-influenza bucket; otherwise, we put them into the influenza bucket.
This is, in fact, the most common thing to do. We call the limit of 50% the threshold of the classification. But it is not the only possible choice. It could be that we wanted to be extra careful about finding patients with influenza. Then we could set the threshold at 30%, meaning more patients would be put into the influenza bucket.
By appropriately adjusting the threshold, we can choose which kind of error we prefer to make in the classification. How to do that can be tuned with methods such as “confusion matrixes” and “ROC curves”. But that is beyond the scope of this intro text.
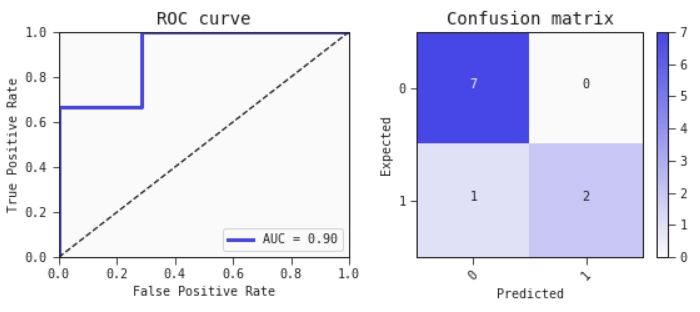
A ROC curve and a confusion matrix derived from the data in this article
Build a classifier yourself!
To help you get started, we have created a code example that shows how to build a classifier with the QLattice in just two lines of code. You can find it on Kaggle here. Just click and sign in to Kaggle, and you will have built a machine learning classifier with the above data in a few minutes.