This is part one of a two-part developer diary on building a stratified data splitter for Abzu’s python library Feyn® and the QLattice®. It will be slightly technical, with the objective to give insights into the decisions and trade-offs we’ve made.
I’ll address first how to build a good data splitter. In part two, I’ll go into how to get stratification right, as it builds on top of the decisions we make here.
Introduction to data splitting.
The `split` function found in `feyn.tools` is suitable for splitting your data into random subsets prior to training a `Model`.
This practice can aid you in validation of the results, by allowing you to evaluate the `Model` on a dataset it has not been trained on, and is a cornerstone in machine learning.
In most real-life cases data is not evenly distributed. To ensure the results you get are reliable, you should take care that significant features are proportionally distributed into the subsets used for training and evaluation.
This process of proportionally distributing samples according to some qualities is called stratification.
Challenges in building a data splitter.
A short note on design philosophy:
A core design philosophy we have is to make `Feyn` easy and intuitive to use for the average user – balancing advanced use cases with abstracting complexity away until necessary.
`Feyn` will be opinionated and help the user make sensible first choices while keeping a high standard of correct behavior.
Getting the data splits right.
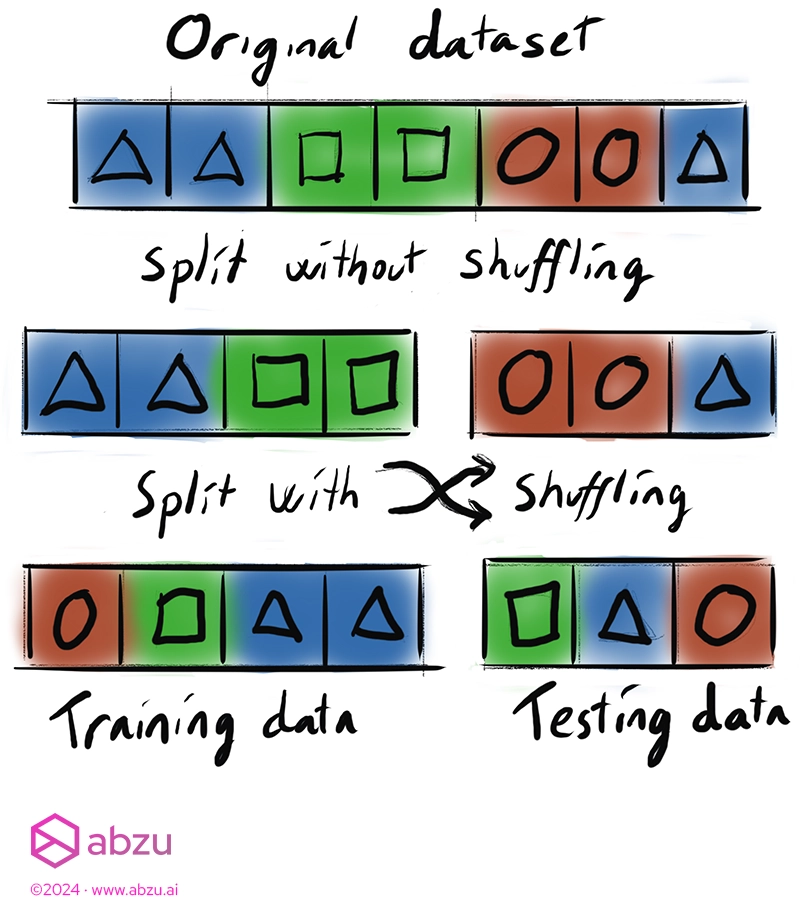
The primary consideration is ensuring that the samples are distributed fairly among the desired bucket sizes. The most common solution is to shuffle the samples to avoid accidental homogeneity in your subsets due to ordering.
It’s worth mentioning that other tools often make shuffling the data optional.
We make the conscious choice to always shuffle, since forgetting to shuffle the data is a common mistake that can result in a worse model and a poor view of its performance.
Always shuffling helps mitigate the sensitivity of the initial ordering of the data set.
Human-readable ratios.
After shuffling, we can now assign the samples to subsets, or splits.
We want the definition of split sizes to be extensible — that is, easily handle two, three or ten splits if you want — but also easy to understand the outcomes of.
To solve this, we use a list of **ratios** instead of traditional percentage-based splits. Those used to percentage-based splits can still use them, but this gives an option for more human-readable bucketing.
With ratios, you can specify the subsets as sizes relative to each other, as if you were physically distributing something.
You might say “For every 10 samples, I want 6 in one bucket and 4 in the other”, or “For every 5 samples, I want 3 in one and 2 in the other”.
Those statements translate to the two ratios:
`6:4` or `3:2`, which is the same as `60% – 40%` or `0.6 – 0.4`.
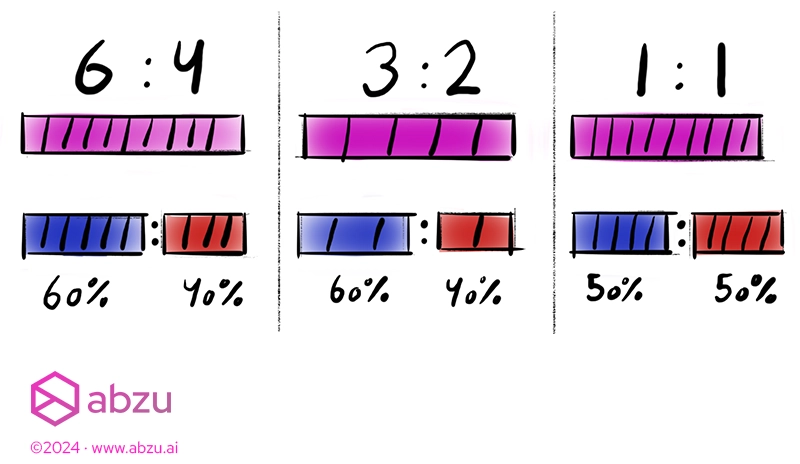
They also all produce the same outcome, but the way we think about them changes which is important for intuition.
Auto-normalization.
We achieve this by automatically normalising the list of ratios back to percentages.
A benefit is that you can also freely extend your splits by adding another set:
– `[6, 4, 2]`
We’re now distributing 12 samples rather than 10. The relationship is kept the same between the two first sets – we just added an extra set.
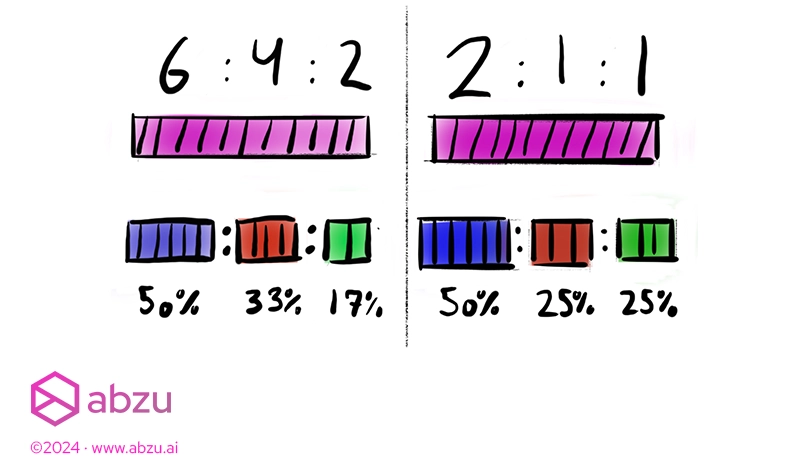
Using percentages would take a bit of math to add up to 100%.
If you just care about the relative sizes and not the absolute sizes, ratios are faster and easier to understand.
How to assign odd splits.
Data sets are rarely a perfect match to the split you want and some bucket will get fewer or more than expected.
Our simple strategy can be described like this:
` ` `
For each ratio in the list:
- Compute the number of samples the set should contain for the ratio, rounded up to the nearest integer.
- Choose a random subset and subtract the difference due to rounding, if any
- Finally split the dataset using the computed sizes
` ` `
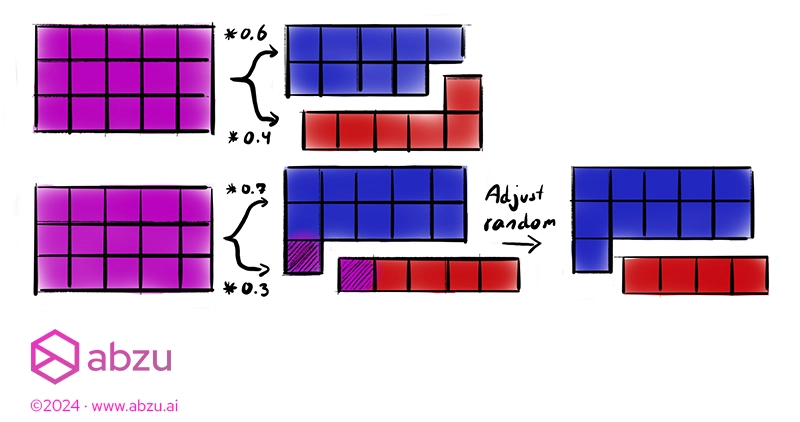
The picture above shows the process for even and uneven splits.
After deciding how many samples go into each split, adjust the size of one random subset so it adds up to the original length.
We pick a random subset for this adjustment to not bias one subset over the other and maximize the fairness.
Finally, we split the dataset according to the sizes.
Missing (NaN) values.
If there are missing values, we treat them as a distinct value and maintain the proportion of missing values for all the subsets.
Other strategies simply remove the values prior to splitting, but this doesn’t apply to us for two reasons:
- It leads to more surprises – why do my splits not sum up to the same length as my input dataframe?
- It’s perfectly valid in `Feyn` to train on missing values, if the column is marked as categorical.
In the context of the `Feyn` workflow, the decision on column types may not have been made at the time of splitting. Since numbers can also be categorical, it’s hard to reliably determine if a column is allowed to have missing values.
It’s sensible to allow the user to fix it with their preferred strategy at a time where they have more information to make the decision on, and we have informative errors during training in `Feyn` to help guide that.
Continuing on to stratification!
In part two, I’ll go into how we modify this approach to accommodate stratification.

Kevin Broløs.
Kevin is Abzu’s Mad Scientist and expert on the QLattice®. With a solid foundation in high-performance computing, his work ensures our tools are at the cutting edge of AI and data science.
More by Kevin: